Employee Survey Report
To access this menu, go to Employee > Employee Report > Employee Survey Report. This report can be displayed based on the survey type.
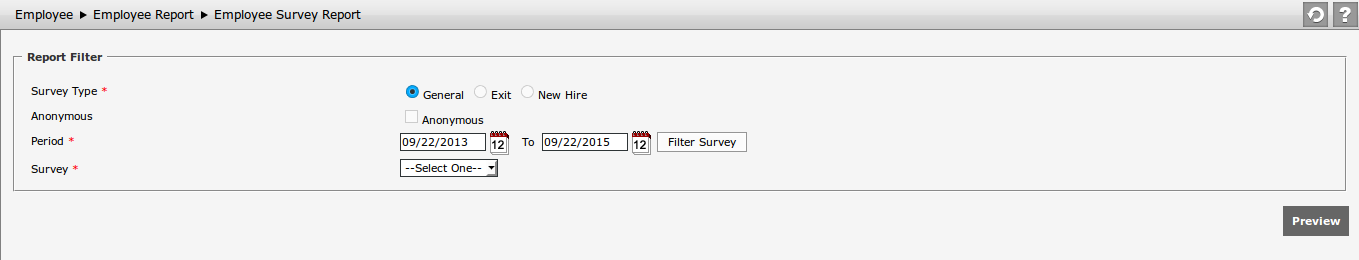
Input the following information before displaying the report:
- Survey
Select the survey period based on determined time period. - Survey Type
Determine the survey type of which data to be displayed on the report, whether General, Exit, or New Hire. - Anonymous
Determine whether the survey to be displayed is anonym or not. - Period
Determine the period of which employee survey data to be displayed on the report by selecting the start date and end date of period followed by clicking to filter survey in determined period.
 - Survey
The option here shows survey periods according to the determined selection before; selected survey type, whether anonymous or not, and determined period.
For survey type of Exit and New Hire, the display would be as the following.
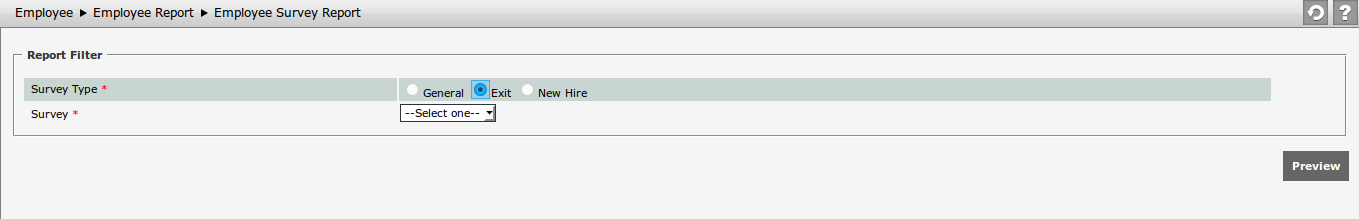
Choose survey to be displayed on the report by clicking ![]() and selecting from available options.
and selecting from available options.
After filtering the data, click  to show Employee Survey Report as the following

The report page shows the following information:
- Survey
It displays the selected survey period name. - Period
It displays the selected survey period date. - Group Filter
The filters displayed in this part are set in Survey Setting . - Question
It consists of 2 parts:- Category
The category colored "Very light grey" or hex "#eeeeee". - Question will be displayed based on the question total of each category which is shown in graphic.
Each question has different type of answer.- 5 Options
The form of this type of answer in the report is indicator chart. There is also its calculation which is:Formula: The total of participant who answers the survey *n / total of all respondents who answer the survey
Note : n = 1-5 (score total of 5 options)
For example, there are 20 respondents who answer the survey with the detail: 5 persons answer the option 1, 3 persons answer the option 2, 2 persons answer the option 3, 10 persons answer the option 4, then the calculation will be ((5*1)+(3*2)+(2*3)+(10*4))/20= 57/20 = 2.85 - Yes/No
The form of this type of answer in the report is Pie Chart. There is also its calculation which is:Formula: Precentage “Yes” = Total of respondent who answers “ Yes” / total of all respondents who answer * 100%
Precentage “No” = Total of respondent who answers “No” / total of all respondents who answer * 100% . - Single
The form of this type of answer in the report is Pie Chart. There is also its calculation which is:
Formula: Precentage “single” n = Total of respondent who answers single n
/ total of all respondents who answer * 100%
Note : n = total of single option in survey question setting
- Multiple
The form of this type of answer in the report is Horizontal Bar. There is also its calculation which is:
Formula: Total of respondent who answer single option n
- Note : n = total of multiple option in survey question setting
- Comment
The form of this type of answer in the report is Link. When the comment link is clicked then the comment answer inputted by the respondent will appear. If there is any same answer, then only one of them will be displayed in the report.
- 5 Options
- Category